The Federal Reserve raised interest rates in September, markets now expect about two more increases by year-end, and the 10-year Treasury yield is at 5.17%. Almost none of the move has come from inflation expectations.
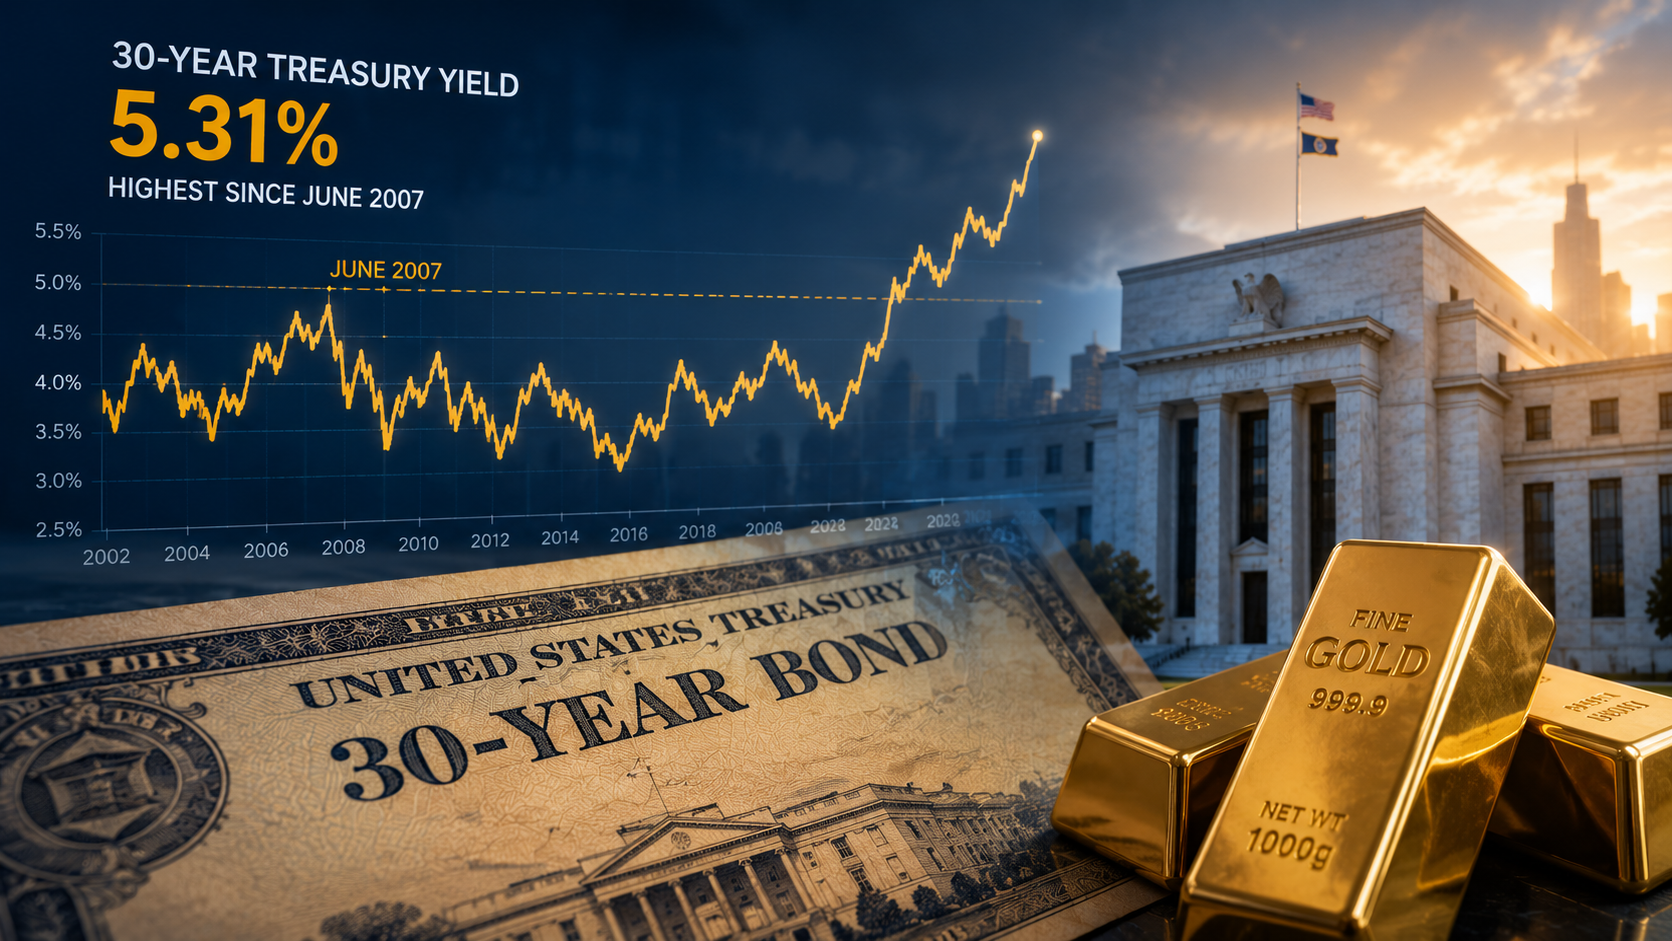
Investors’ expectations for the Federal Reserve’s policy rate can be read from market prices. On January 2nd the expectation was for ratecuts: the expected rate for mid-2027 was 3.16%, below the 3.50% to 3.75% target range then in place. Nine months, one oil shock and one rate increase later, the same figure is 4.79%. The 10-year Treasury yield, the benchmark behind mortgage rates and most long-term borrowing costs, closed Friday at 5.17%, its highest since 2007. The S&P 500 sits about 1.5% below the record it set on August 13, before September’s move in rates, and has been flat since August 31 while the 10-year yield rose 0.42 percentage points. Many investors are watching the Fed. The more useful place to look may be the bond market’s explanation of why.
| Three numbers 1.63 percentage points. The rise since January 2 in the market’s expected Fed policy rate for June 2027, from 3.16% to 4.79%. The Fed raised rates once, on September 16. Pricing for December now sits about half a point above the middle of the new target range, the equivalent of two more quarter-point increases by year-end. 2.83%. The 10-year Treasury’s real yield, its yield after subtracting expected inflation, up from 1.93% at the start of the year. Expected inflation moved just 0.09 percentage points over the same period, even as oil went from $61 to $138 a barrel and back to $115. Minus 0.62. How daily moves in the S&P 500 have lined up with daily moves in the 10-year yield, negative since April. For six months, stocks have tended to fall on the days yields rose, pressuring stock and bond prices at the same time. |
What the market expects the Fed to do

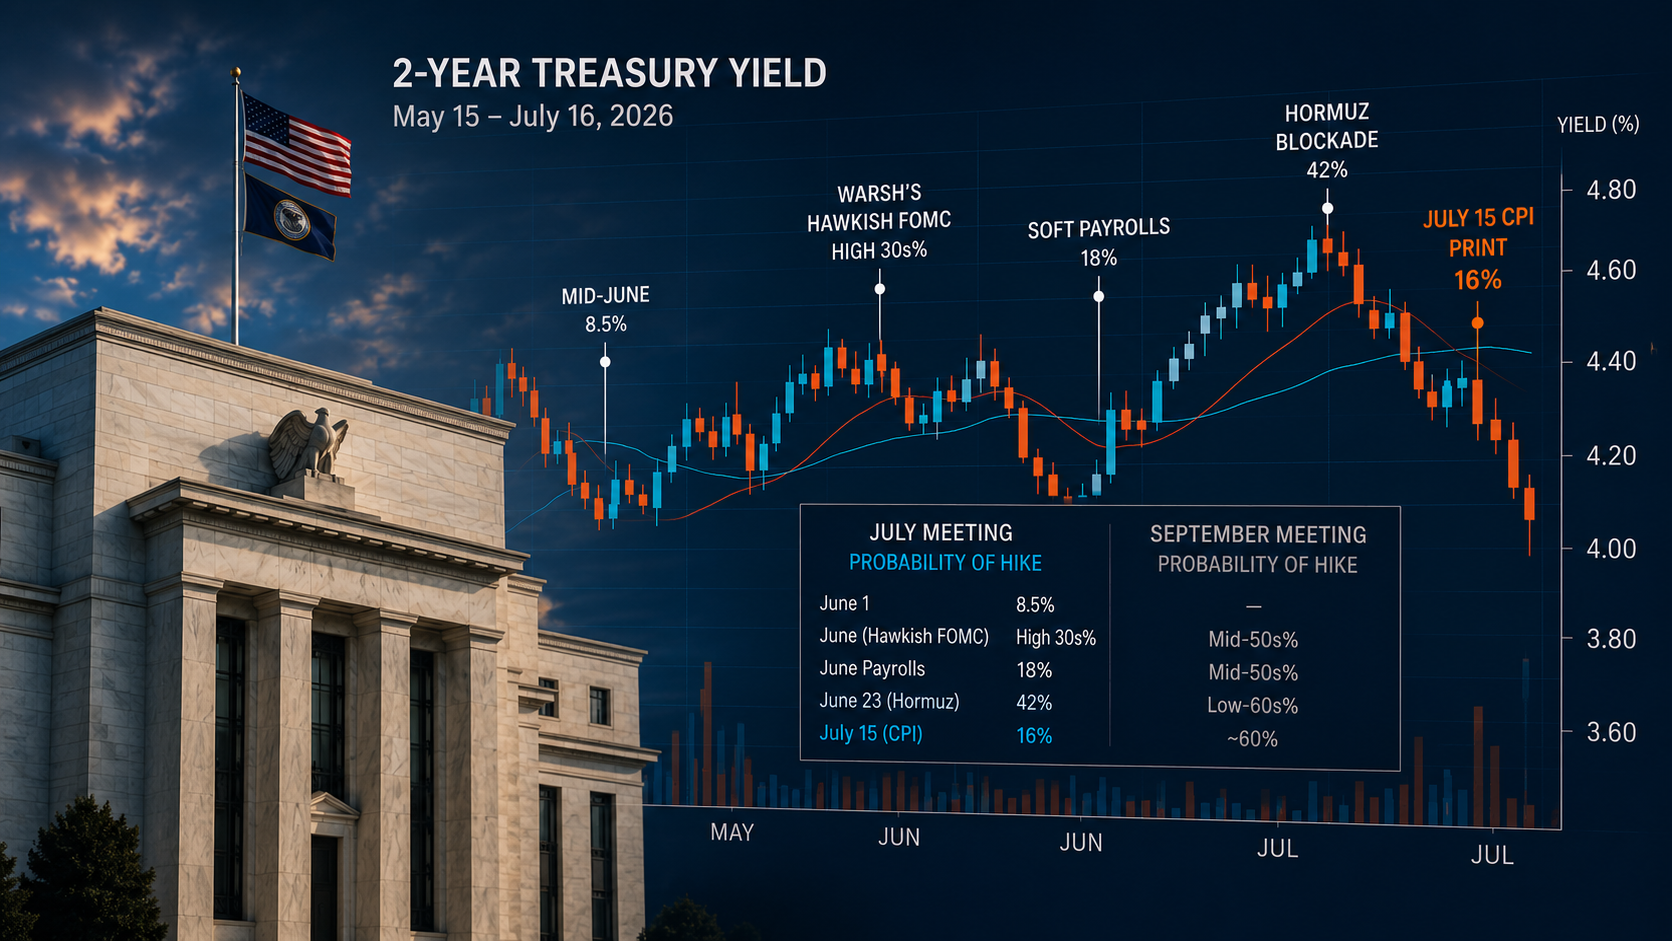
Exhibit 1 tracks the market’s expected Fed policy rate for two future dates: a jump in March as oil spiked, a steady climb through the summer, and a sharp move in September. The Fed raised its target range by a quarter point on September 16, to 3.75% to 4.00%, a midpoint of 3.875%. By September 25 the expected rate for December was 4.35%, about half a percentage point higher, and market prices put a 93% probability on rates ending the year above today’s range. In plain terms, investors expect roughly two more quarter-point increases by year-end. The expected rate for June 2027 has risen 0.51 percentage points since August 31 and 1.63 since January, most of it after the Fed’s meeting rather than before it. The Fed’s own projections put the year-end rate at about 4.1%, one more increase; the market has gone a step further. These are averages across many possible outcomes, not predictions, but the message appears to be that the market is pricing the September increase as potentially the start of further tightening, rather than the end.
The rise in yields is not about expected inflation

A Treasury yield has two parts: the inflation investors expect over the bond’s life, measured by comparing regular and inflation-protected Treasuries and called the breakeven rate, and what is left after inflation, the real yield. Exhibit 2 shows both. The 10-year yield has risen 0.99 percentage points this year, from 4.18% to 5.17%. Expected inflation accounts for 0.09 of that, moving from 2.25% to 2.34%. The other 0.90 is real yield, up from 1.93% to 2.83%, with 0.40 of it in September alone. Meanwhile Brent crude went from $61 a barrel in January to $138 on April 7, back to $70 in June, and to $115 on September 22, the latest reading, and through that round trip expected inflation never left a 2.2% to 2.5% band. Real yields reflect more than one thing, including compensation for holding a long bond and the volume of Treasury issuance, so the split does not settle the cause by itself. Our read is that the largest piece is the expected path of Fed policy: investors have marked up real yields in step with their expectation that the Fed will keep rates higher for longer in response to the oil shock.
Stocks and bonds have been moving in the same direction

Exhibit 3 is particularly relevant to portfolio construction. It shows the correlation (a statistic from plus 1 to minus 1) between daily changes in the S&P 500 and daily changes in the 10-year yield over rolling 40-day windows. Bond prices move opposite to yields, so a positive reading means bond prices tended to rise on days stocks fell, the pattern a balanced portfolio relies on. The reading crossed below zero in March and has stayed there, between roughly minus 0.5 and minus 0.8 since April and at minus 0.62 on Friday. Below zero, stocks have tended to fall on the days yields rose, pressuring stock and bond prices at the same time. Since August 31 the S&P 500 is flat and a 10-year Treasury note has lost roughly 3% of its price from the rise in yields alone. Six months of that is not a blip; it has been a persistent feature of the current environment.
What to take from it
When a central bank raises rates in response to an oil shock, the same force weighing on stocks can push bond prices lower at the same time, a difficult environment for a traditional balanced portfolio. That is what the past six months have looked like, and with two more increases currently reflected in market expectations by year-end, those conditions those conditions may remain in place.
The implication is not that bonds have permanently lost their value as a diversifier. It is that the relationship should not be assumed. When stock and bond prices are moving together investors may consider how different sources of diversification have historically behaved, including strategies designed to manage downside risk or adjust market exposure as conditions change. Exhibit 3 illustrates whether the traditional relationship is reasserting itself. Until it does, the current correlation provides a measure of the relationship between recent stock and bond market movements.
Disclaimer
Xtollo Investment Partners, LLC (“XIP”) is not a registered investment adviser or broker-dealer. XIP, Portfolio Solutions (“XPS”), a DBA of Kensington Asset Management (“KAM”) and The Leuthold Group (“Leuthold”) are affiliated entities under common ownership. Advisory services are provided KAM (XPS). XIP promotes KAM and Leuthold strategies and funds and receives compensation for these activities, which creates a conflict of interest. Current Form ADV Part 2A (Firm Brochure) for both KAM(XPS) and Leuthold are available upon request and through the SEC’s IAPD at adviserinfo.sec.gov.
Investing involves risk, including possible loss of principal. Past performance does not guarantee future results. No strategy, including diversification, ensures a profit or prevents loss.
Any indices and other financial benchmarks shown are provided for illustrative purposes only, are unmanaged, reflect reinvestment of income and dividends and do not reflect the impact of advisory fees. Investors cannot invest directly in an index. Comparisons to indexes have limitations because indexes have volatility and other material characteristics that may differ from a particular strategy such as the types of securities being substantially different.
This material is for informational purposes only and is not individualized investment advice or an offer to buy or sell any security. Information presented may not reflect current views due to changing market conditions.
Our materials may contain information deemed to be correct and appropriate at a given time but may not reflect our current views or opinions due to changing market conditions. No information provided should be viewed as or used as a substitute for individualized investment advice. An investor should consider the investment objectives, risks, charges, and expenses of the investment and the strategy carefully before investing.
KAM (XPS) relies on third party sources for some of its information that we believe is reliable. However, we make no representation, warranty, endorse or affirm as to its accuracy or completeness. The information provided is current as of the date of publication and may be subject to change. We are not responsible for updating this information to reflect any subsequent developments or events.
Certain information contained herein constitutes “forward-looking statements,” which can be identified using forward-looking terminology such as “may,” “will,” “should,” “expect,” “anticipate,” “project,” “estimate,” “intend,” “continue,” or “believe,” or the negatives thereof or other variations thereon or comparable terminology. Due to various risks and uncertainties, actual events, results, or actual performance may differ materially from those reflected or contemplated in such forward-looking statements. Nothing contained herein may be relied upon as a guarantee, promise, assurance, or a representation as to the future.
Document ID: XT4575581370