July was, at the index level, among the least eventful months of the year. The S&P 500 finished it down 0.13%, a move small enough to round to nothing in a client review. Beneath that surface the same month took the S&P 500 Momentum Index down 11.06% and the PHLX (Philadelphia Stock Exchange) Semiconductor Index down 20.61%, while the average S&P 500 constituent, as measured by the equal weight index, actually gained ground.
That combination is not a contradiction, and working out why it is not says something useful about how far a headline index number can be trusted to describe the risk underneath it. The short version is that July was a rotation rather than a decline, and that the options market had been priced in a way that let a rotation this severe pass without showing up at the index level.
The Unwind Happened Inside a Very Good Year
The drawdown figures below read very differently without their context, so it is worth establishing first that all of this took place inside a strong year. Semiconductors entered August up 69.3% year to date and momentum up 24.6%, both after the declines described here, with the S&P 500 up 13.3% and equal weight up 14.9%. Whatever July was, it was a violent round trip within a rally rather than the opening of a bear market, and nothing that follows should be read as arguing otherwise.

Exhibit 1: Cumulative price return, December 31, 2025 through August 10, 2026.
Source: Bloomberg.
Sixteen Percent, Hidden Under Two
Measured from the June 22 peak to the July 29 trough, the S&P 500 gave up 2.10%. Over those same sessions the momentum index fell 15.69% and semiconductors fell 28.61%, while equal weight rose 2.84%.
It is that last figure that explains the rest of them. Money did not leave the equity market in July, it moved from one set of positions into another, and because an index is a weighted average of both sides of that trade, the transfer nets out almost entirely at the top line. A rotation large enough to take a factor down sixteen percent can therefore pass beneath a two percent index move without leaving a trace, not because the index is measuring anything incorrectly, but because averaging is what an index is built to do.
Morgan Stanley’s sector-neutral momentum index fell 17.4% across four sessions, which Jonathan Krinsky of BTIG, an institutional brokerage and research firm, identified as the worst four-day stretch in that series’ history, exceeding both the dot-com unwind and the Covid crash. Our long-only measure was less extreme but tells the same story: the S&P 500 Momentum Index fell 9.05% from July 23 through July 29 while the S&P 500 lost just 1.24%.
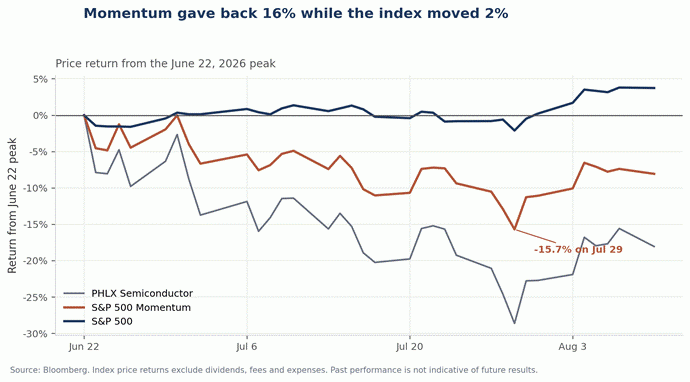
Exhibit 2: Price return from the June 22, 2026 peak.
Source: Bloomberg.
Why the Index Barely Moved
Implied correlation is the cleanest way to see how the market was arranged going in. The measure captures the premium of S&P 500 index options over options on the fifty largest stocks inside it, and it falls when traders are willing to pay up for those stocks to move independently of one another. Independent movement is one condition that can allow a crowded factor to unwind without materially affecting the index.
On July 10, the Cboe (Chicago Board Options Exchange) 3-Month Implied Correlation Index closed at 7.19, the lowest reading in the history of the series, against an average of 26 since its 2021 inception. That is not one strange print in an otherwise normal year. The index has averaged 14.3 across 2026 versus 27.7 over the 2021 through 2025 period, and at 11.14 today it sits in the sixth percentile of the five years over which the series has existed, which describes a regime rather than a moment.
None of which makes it a timing tool, and we would rather say so plainly than let the sequence imply otherwise. One episode is one observation. What the record supports is that the conditions for a dispersion event were visible in options pricing well before the event arrived, not that options pricing called it.

Exhibit 3: Cboe 3-Month Implied Correlation Index, July 2021 inception through August 10, 2026.
Source: Bloomberg, Cboe Global Markets.
What Has Changed Since the Trough
What has happened since runs against the tidier version of this story, because correlation did not stay at its lows through the crash. Between July 22 and July 29, as momentum completed its decline, implied correlation climbed from 7.54 to 12.99 and the gap between average constituent volatility and index volatility narrowed from 33.5 points to 27.2. That is the mechanical signature of a crowded position coming apart: the stocks inside the trade stop behaving like separate securities and begin behaving like one, which is dispersion running in reverse.
The compression has continued past the trough, though now from the other direction. Average constituent implied volatility has fallen from roughly 50 to 39.7 since late July while the VIX (Cboe Volatility Index) has gone essentially nowhere, moving from 15.7 to 15.5, leaving the spread at 24.3 points against its July 9 peak of 34.1. The market does not appear to be repricing index risk. Much of the move appears concentrated in single stock volatility expectations, which have fallen steadily since the unwind while the index leg remained relatively unchanged. Whether that reflects a genuine change of view or simply the decay of elevated expectations after an episode of this kind, the direction is the same, and single stock risk premium is coming out.

Exhibit 4: Average S&P 500 constituent implied volatility versus index implied volatility.
Source: Bloomberg, Cboe Global Markets.
What We Take From It
We are not going to turn any of this into a forecast, partly because the evidence does not support one and partly because the more useful conclusion is not directional. It is that a sixteen percent factor round trip completing underneath a two percent index move is not an anomaly in a low correlation regime. It is precisely the kind of divergence such a regime can produce.
Index-level risk statistics are averages of components that are, on the market’s own pricing, less and less inclined to move together, and an average may be an incomplete description of a distribution that wide. At a correlation reading in the sixth percentile of its recorded history, portfolios monitored principally at the index level should be understood to carry exposures the index will not reveal, in either direction, until something forces their constituents back into line.
IMPORTANT DISCLOSURES
This material is provided for informational and educational purposes only and does not constitute investment, legal, tax or accounting advice, nor an offer or solicitation to buy or sell any security. Company names appear solely to illustrate the accounting and cash flow dynamics discussed and are not recommendations to buy, sell or hold any security. Xtollo Investment Partners and its affiliates, employees and clients may hold positions in the securities reference.
Statements regarding future periods reflect historical trend analysis and modeled assumptions, including assumed asset useful lives, and are subject to significant uncertainty. Actual results will differ materially from those discussed. Trend-based estimates are sensitive to the fit window, model assumptions, seasonality in operating cash flow, changes in capital spending, finance conditions, and other factors, and should not be viewed as predictions of company results.
Dates and crossover points shown in Exhibit 4 are model-based estimates derived from historical trends and current assumptions. Actual timing and outcomes may differ materially. Third-party data is believed reliable but has not been independently verified. Past performance is not indicative of future results.
The views and opinions expressed are those of the author as of the date indicated and are subject to change without notice. Market and economic conditions may change and no assurance can be given that any trends discussed will continue.
Xtollo Investment Partners, Austin, Texas. Document XT4530435607.