What underperformance is supposed to cost, and how to tell when it costs too much
Most defensive equity strategies make some version of the same trade. They give up some portion of the market’s gains in exchange for absorbing less of its losses. Advisors know this in the abstract, and then a year arrives where the index runs and the defensive sleeve does not, and the client asks why they own it. The honest answer is not about sleeping at night. It is arithmetic, and the arithmetic is more interesting than the platitude.
The Line That Ties the Index
Up capture and down capture describe how much of the index’s gains and losses a strategy absorbs. Hold the sample fixed and the two are not independent. For any level of up capture there is exactly one level of down capture that produces the same compound return as the index over the period. Plot every one of those pairs and you get a line. The index sits on it at 100/100, as it must. Anything below the line beat the index, anything above it lagged. The profiles below are hypothetical constant-capture examples, not the realized capture statistics an advisor sees in a fund report.
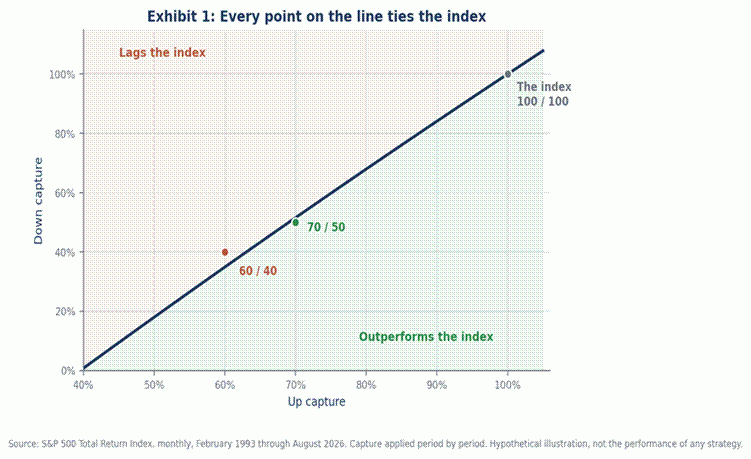
Exhibit 1: The break-even capture frontier, S&P 500 Total Return Index, February 1993 through August 2026.
Across the S&P 500’s monthly total returns since February 1993, a strategy capturing 70 percent of up months needed down capture below 51.6 percent to keep pace. At 80 percent up capture the threshold was 68.0 percent, and at 90 percent it was 84.1 percent. The line is specific to this index. A strategy measured against a bond benchmark faces a different one, because the distribution of monthly returns is different.
The Exchange Rate
The slope of that line reflects the historical trade-off associated with downside-risk reduction, and it is roughly 1.6. One point of lost up capture requires roughly 1.6 points of improved down capture to offset it. Upside participation therefore carries a surprisingly high value, and the reason is frequency. Two of every three months in this sample were positive, so upside forgone compounds against you in most of them.
Nor is the price fixed. Decade by decade, the line moves violently.

Exhibit 2: The same frontier computed over four sub-periods. All four converge at 100/100, because the index always ties itself.
From 1993 through 1999, a strategy at 70 percent up capture needed down capture under 14.9 percent to tie the index, an extraordinarily demanding hurdle. From 2000 through 2009 the same threshold rose to 72.7 percent, a far more forgiving trade. The 2010s sat at 38.7 percent and the period since 2020 at 46.7 percent. The trade is not a fixed exchange. It is a position on which distribution of returns actually shows up.
Same Destination, Half the Hole
Return alone cannot settle the question, because the break-even line is defined by return. So take the profile sitting exactly on the line, at 70 percent up and 51.6 percent down. Its compound return matches the index by construction, at 10.86 percent. Its worst drawdown was 28.8 percent against the index’s 50.8 percent. The rounder 70/50 profile below sits just inside the line and compounded slightly ahead, at 11.12 percent.

Exhibit 3: A 70/50 capture profile against the index, with drawdown shown below. Hypothetical illustration.
Strip the return out, as the break-even profile does by construction, and what remains is that a 28.8 percent hole and a 50.8 percent hole are not the same thing to live through.
Not every defensive profile clears the bar. A 60/40 capture profile gave up more upside than its protection bought back and compounded at 10.00 percent, below the index, despite a shallower worst loss of 22.6 percent. Downside-risk reduction has a cost and it is possible to pay more for it than the historical benefit received.
What to Ask Instead
These capture ratios are held constant for 33 years, which no live strategy manages. The point is not the coordinates but the map. When a defensive strategy lags, the question is not whether it lagged. It is what it received in exchange, and whether the market has yet delivered the distribution it was intended to address.
Methodology
Data: S&P 500 Total Return Index, monthly returns, February 1993 through August 2026 (403 observations, no gaps). The 1993 year covers February through December; 2026 covers January through August. Monthly returns compound to the stated annual totals in the source file with no discrepancy.
Capture definition: strategy return equals up capture times the index return in months where the index rose, and down capture times the index return in months where it fell or was flat. Capture is applied period by period, so the actual sequence and compounding of returns is preserved rather than approximated from period averages.
Break-even frontier: for each level of up capture, the down capture that equates the strategy’s terminal compound growth to the index’s over the same sample, solved numerically by bisection. Terminal growth is monotonically decreasing in down capture, so the solution is unique. The identity case returns up capture equal to down capture equal to 100 percent, confirming the index lies on its own frontier.
Limitations: capture ratios are held constant across the full sample, which no live strategy achieves, and realized capture measured over short windows is noisy. The frontier is specific to the return distribution of the index used and does not transfer to strategies measured against a different benchmark. All figures are hypothetical illustrations of capture arithmetic and do not represent the performance of any strategy, account, or fund.
XT558950476