For much of the past cycle, market performance has been driven by a very narrow group of mega-cap stocks. That dynamic can persist longer than expected, but when leadership begins to broaden, the transition is rarely smooth.
This week’s charts highlight why. When a handful of stocks represent an outsized share of the index, the S&P 500 can behave like a concentrated portfolio. As leadership rotates away from those names and participation improves elsewhere, the index can appear calm even while the market underneath becomes far more volatile and differentiated.
Concentration Still Matters
As of year-end 2025, the Magnificent 7 were roughly as large as the bottom 448 stocks in the S&P 500, which means the index is still heavily influenced by a small handful of names. When leadership is narrow, strong mega-cap performance can make the market look healthier than it is beneath the surface. And when leadership starts to broaden, the index can appear stuck, even as participation improves, because the benchmark is still digesting the shift away from its largest weights.

Source: S&P Global as of December 31, 2025
Broadening often shows up as dispersion first
A classic hallmark of a rotation market is elevated dispersion, meaning individual stocks are moving a lot even when the index is not. Over the past month the S&P 500 (SPX) was flat, while individual stocks in the index moved by an average of 10.8% (as of February 13, 2026). The gap between the index move and the average stock move of 10.5% ranks in the 99th percentile over the past 30 years, pointing to unusually chaotic stock-level performance despite a calm index headline. This is often what broadening looks like in real time: less uniform index beta, more sector and style cross-currents, and more frequent changes in leadership. Put simply, broadening can be constructive, but the early stages usually arrive with more churn than investors expect.

Source: Nomura as of February 13, 2026
The bumpy part shows up in sharp air pockets
Higher dispersion tends to bring more violent single-day moves as capital rotates quickly between winners and losers. Over the last eight sessions (as of February 13), 115 stocks in the S&P 500 fell 7% or more in a single day. Historically, clusters like that have coincided with an average peak-to-trough drawdown of roughly 34%. Yet at the time of the chart, the S&P 500 was only down about 2%, a clear reminder that index-level calm can mask significant stress and repricing beneath the surface.
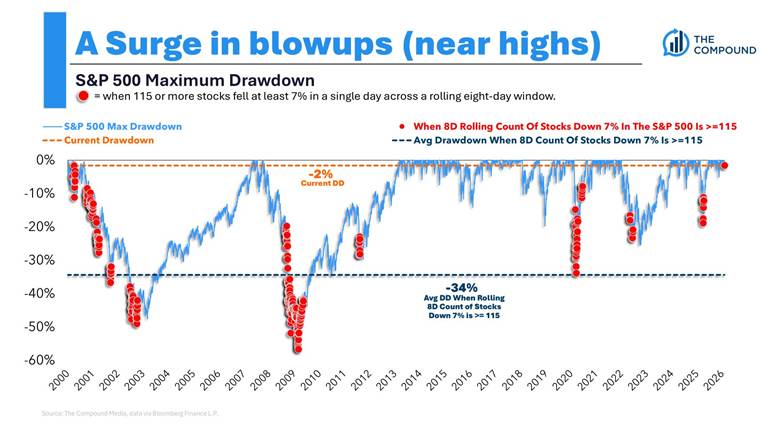
Source: The Compound as of February 13, 2026
Rising volatility is consistent with a transition phase
In periods where leadership is shifting, volatility often rises even if the index remains relatively stable. The CBOE Volatility Index (VIX) has risen five weeks in a row and recorded its highest Friday close since November. In practice, a higher VIX typically means wider daily ranges, more headline sensitivity, and more frequent reversals as leadership rotates. Volatility is not inherently bearish, but it is often the cost of admission during a broadening phase.

Source: StockCharts.com as of February 13, 2026
Evidence the baton may be moving
If leadership is broadening, we would expect to see performance improve outside the mega-cap complex. Through February 13th. 2026, the S&P 500 was ~0.1%, while the Russell 2000 is up ~6.6%. At the sector level, small caps have led large caps in Communication Services, Consumer Discretionary, and Financials. This is consistent with early signs of a baton pass.
This does not mean small-cap leadership will be linear or persistent. Rotation phases often include sharp reversals and localized drawdowns before trends reassert. But it does reinforce the larger point: market performance may be becoming less dependent on a narrow set of names, even if the index headline does not fully reflect it yet.

Source: Bespoke Investment Group as of February 13, 2026
Bottom line
A broadening market can ultimately be a better market, particularly if participation improves and leadership becomes less concentrated. The trade-off is that the transition phase often comes with higher dispersion, sharper single-day moves, and elevated volatility.
Portfolio considerations
- Avoid over-reading index calm. When dispersion is elevated, the index can mask meaningful shifts beneath the surface.
- Expect a choppier tape during the handoff. Rotation markets often feature sharp reversals and localized drawdowns before trends reassert themselves.
- Let diversification do its job, but do not expect it to feel orderly. If leadership broadens, diversified portfolios can benefit, even though the path is often noisy.
XT20251218A