Investors have heard two familiar storylines repeatedly over the last year:
- The market is being held up by a handful of mega-cap tech stocks.
- Valuations are stretched, so this must be a bubble.
Both points contain a kernel of truth, but they miss what has actually been happening under the surface. The S&P 500 finished 2025 up 17.88%, marking the third consecutive year of gains.
The more important takeaway for 2026 is not just that the market was higher, it is how we got there.
The evidence points to a bull market supported by fundamentals and broadening participation. That does not eliminate risk, but it does shift the discussion from “this is all hype” to “this is a cycle that still requires disciplined risk management.”
Returns have been driven more by fundamentals than by valuation expansion
A useful way to pressure-test the “bubble” label is to look at what is doing the work, earnings and cash flows, or valuation multiples.
Over the past six years, the S&P 500 is up 132%, and only 26% of that gain came from multiple expansion. The rest came from sales growth, margin growth, and dividends.
That matters because bubble-like environments typically lean heavily on valuation re-rating. When multiples are the primary engine, markets become more vulnerable to disappointment, since any earnings wobble can produce a double hit (lower earnings and lower multiples). A market that is being pulled forward largely by sales and margin improvement tends to have a sturdier foundation, even if valuations are not cheap.
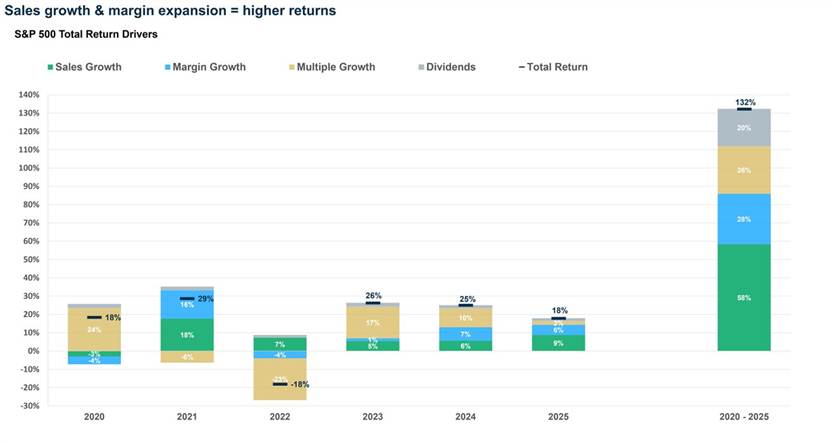
Source: Carson Investment Research as of December 31, 2025
Broader participation has been a feature, not a surprise development
The “Magnificent 7 only” narrative has been powerful because it was directionally true at points in 2023 and 2024. But in 2025, participation broadened. The other 493 stocks contributed more to index gains (10.4%) than the Magnificent 7 did (7.5%), the first time that has happened in three years. Even more notable, the “493” contribution has been consistent across multiple years, adding 10.0%, 11.7%, and 10.4% over the last three years. That kind of consistency is not what “seven-stock market” headlines imply.
Why do we care about this from a market structure perspective?
- Breadth reduces fragility. When market leadership is extremely narrow, the index is more vulnerable to a small set of names derailing performance. When participation broadens, leadership can rotate without breaking the broader uptrend.
- Breadth often aligns with healthier earnings breadth. More companies contributing usually means the market is not relying on one theme to justify the overall price level.

Source: Carson Investment Research as of December 31, 2025
Leadership has been more nuanced than headlines suggest
Another statistic helps clarify what “broadening” has looked like in practice. In 2025, only two Magnificent 7 stocks outperformed the S&P 500, Google and Nvidia. This does not argue that mega-caps are irrelevant. It argues that leadership has become more balanced:
- Some mega-cap winners remained winners.
- Several became market performers, even while remaining high-quality businesses.
- Meanwhile, a wider group of companies did enough to collectively support index performance.
That is what broadening looks like in real time. It is rarely a clean handoff from one sector to another. It usually shows up as dispersion, rotation, and less concentration in index leadership.

Source: Creative Planning as of December 31, 2025
Valuations are elevated, but elevated does not automatically equal bubble
Valuation is a legitimate concern, and it should shape risk management. The S&P 500’s forward P/E is elevated by historical standards, around 21.8. At the same time, valuations, by themselves, are not a reliable timing tool. On September 1, 2020, the forward P/E was even higher at 23.2, and the S&P 500 has been up 94% since then, despite a bear market in 2022.
The correct takeaway is twofold:
- Valuation can compress long-term expected returns, especially if the next recession hits while multiples are elevated.
- Valuation alone rarely tells you when to exit, particularly when fundamentals and breadth are supportive.
This is one reason “bubble” is often an unhelpful label. It turns a risk input (valuation) into a timing decision, which history shows is a difficult way to navigate markets consistently.

Source: Yardeni Research as of December 31, 2025
The long-term base rate still matters
It is easy to forget, in the middle of noisy headlines and periodic drawdowns, that equity markets have historically had an upward bias over time. Out of the last 98 years, the S&P 500 has been positive in 72 of them, meaning it has been up 73% of the time. That is not a forecast, and it does not eliminate the reality of drawdowns. But it is a reminder that uncertainty and volatility are the normal cost of admission, and that the market’s long-term pattern has been positive more often than not.

Source: Creative Planning as of December 31, 2025
What this means for 2026
This is not an argument that risk is low, or that valuations do not matter. It is an argument that the market’s underlying support looks better than the simplistic narrative suggests.
- The “bubble” label is harder to defend if only a minority of multi-year gains came from multiple expansion and the majority came from sales growth, margin growth, and dividends.
- The “seven-stock market” label is harder to defend when the other 493 have been durable contributors and the Magnificent 7 were not uniformly dominant at the stock level.
- The “valuation risk” label remains valid, but it is best used as a risk management input, not a timing trigger.
Valuations can inform expectations, but they are not a reliable timing tool by themselves. Rather than guessing at tops, we believe in a rules-based approach that stays exposed when conditions are supportive and can move defensively, sometimes all the way, when evidence breaks down.
XT20260106