The S&P 500 just suffered its 6th fastest 10%+ correction in the last 75 years—falling more than 10% in just 22 trading days. The key question is whether this sharp pullback is a healthy correction that sets the stage for a rebound, or the start of a deeper downturn associated with an approaching US recession. History shows that the presence (or absence) of a recession is the decisive factor in post-correction paths (chart below). With that in mind, let’s explore some key recession signals and how they compare to today’s environment.

Source: Fred Goodwin, State Street as of March 24, 2025
Recession Risk Dashboard: Mixed Signals from Key Indicators
The Conference Board US Leading Economic Index (LEI) – a composite of 10 forward-looking indicators – has fallen sharply (down ~17% from its peak) and is at levels last seen in 2020, though the rate of decline has moderated significantly in recent months. Every prior decline of this magnitude preceded a recession (chart below).

The US yield curve (e.g. 10-yr minus 2-yr Treasury yield) has recently un-inverted after being deeply negative for much of the past two years. Historically, this re-steepening tends to happen just before or during the early stages of a recession—not after the risk has passed.

On the other hand, the labor market, while showing signs of softening, remains generally healthy. Unemployment has edged up to 4.1%, and nonfarm payroll gains have slowed, but they remain in positive territory. Jobless claims have ticked higher but are not at recessionary levels. The economy is clearly cooling, but it hasn’t cracked…yet.
Together, these indicators paint a picture of an economy on edge—cooling but not yet contracting.
Valuations: Back Toward Neutral, But Still Earnings-Dependent
The recent correction has brought valuations closer to long-term averages. The S&P 500 now trades at approximately 20.4x forward earnings—slightly above its 5-year average (19.0x) and modestly higher than its 10-year average (18.3x). While not cheap, valuations are no longer at the stretched levels seen earlier this year.
Consensus earnings growth for 2025 has been revised modestly lower but still calls for a solid 11–12% increase. If earnings come through, current multiples look reasonable. But if growth falters—especially in a slowing economic environment—valuations could quickly become a headwind again.

Sentiment and Positioning: A Contrarian Set-Up?
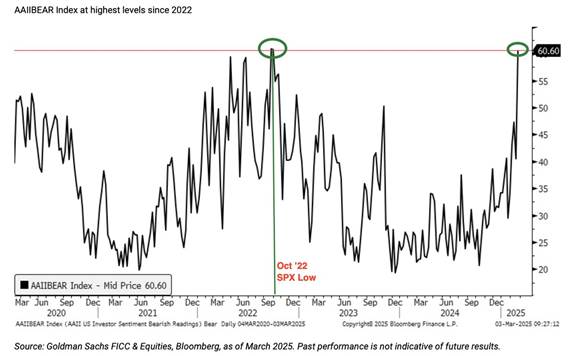
Investor sentiment has become extremely bearish. The latest American Association of Individual Investors (AAII) survey shows a bull-bear spread of –36%, a level seen only a few times in the past decade. Such sentiment extremes often coincide with market lows (see October 2022). Fund managers have raised cash levels and reduced equity exposure, and retail flows have turned defensive. Such deeply negative sentiment often sets the stage for a rebound—provided the data doesn’t confirm the worst.
Trade Policy and Fed Outlook: April 2 Could Tip the Scales
As discussed in our March 13 Market Insights, trade policy has reemerged as a major market catalyst. Attention now turns to President Trump’s “Liberation Day” on April 2, when a new slate of reciprocal tariffs is expected to be announced. While the scope may be narrower than originally feared, the move could either reinforce business confidence—or exacerbate supply chain pressures and inflation risks.
The outcome matters because it could directly impact the recession outlook. A heavy-handed tariff regime could weigh on corporate margins, dampen investment, and further strain an already cooling economy. On the other hand, a measured approach could reduce uncertainty and support soft-landing hopes.
The Fed, for its part, remains on hold at 4.25%–4.50%, with markets expecting potential rate cuts later this year. But if tariffs fuel a growth slowdown—or reignite inflation—the path forward for policy could shift. April 2 may not just move markets—it could influence whether the slowdown we’re seeing now becomes something more systemic.
Conclusion: At a Crossroads
The next few months will likely determine whether this correction marks the end of the bull market or a healthy reset before a renewed advance. While the economy is slowing, a recession is not yet confirmed. If we avoid one, the odds favor a recovery—particularly with sentiment so washed out and valuations off their highs. But if a downturn materializes and earnings falter, further downside is likely.
Either way, markets are in a wait-and-see mode. Data on inflation, employment, and corporate profits will guide the way forward. For now, the prudent course is to stay data-dependent—because whether this correction is the start of a recession or just a scare, the data will tell the story.